
How Widespread are Risky Facilities?
The first paper to discuss the concept of risky facilities identified nearly 40 studies of specific types of facilities that included data about variations in the risks of crime, disorder, or misconduct.3 These studies covered a wide range of facilities and many different types of crime and deviance, including robbery, theft, assault, and simple disorder. All the studies showed wide variations in risk in the facilities studied and in many there was clear evidence of high concentrations of risk consistent with the definition of risky facilities.§ There follow a few examples.
§ Not every study provided clear evidence that a small proportion of the facilities accounted for a large proportion of the crime, disorder, or misconduct. Rather, some reported differences between facilities in crime numbers or rates; for example, Matthews, Pease & Pease (2001) [PDF] reported that "4 percent of banks had robbery rates four to six times that of other banks." Although consistent with the concept of risky facilities, these figures do not satisfy a key component of the definition: they do not demonstrate that a small number of high-risk banks accounted for a large part of the robbery problem. However, this does not mean that risks for the facilities studied were not highly skewed. Rather, it only means that the data did not allow the distribution of risk to be examined.
- Convenience stores: a national survey found that 6.5 percent of U.S. convenience stores experience 65 percent of all convenience store robberies.4
- Bars and taverns: around 30 percent of the 1698 taverns in Milwaukee, Wisconsin experienced about 80 percent of violent incidents reported between 1986 and 1990.5 Similarly, 3 of the 15 (20 percent) bars in Shawnee, Kansas, accounted for 62 percent of calls for police service between 2002 and 2004. 6
- Gas stations: 10 percent of Austin, Texas gas stations accounted for more than 50 percent of calls for drive-offs and drug crimes between 1998 and 1999.7
- Schools: 8 percent of schools in Stockholm, Sweden experienced 50 percent of the violent crimes reported in 1993 and 1994. 8 In another study, researchers found that 18 percent of Merseyside schools in North West England reported 50 percent of calls for burglary and criminal damage.9
- Payphones: a 1998 study found that 20 percent of hoax calls to the fire brigade made from public telephone kiosks in Merseyside came from just 3 percent (33 out of 1189) of the phones. 10
- Bus routes and bus stops: another study in Merseyside showed that about 4 percent of bus routes experienced 80 percent of all reported crime incidents on bus routes and that about 5 percent of bus stops experienced nearly 30 percent of vandal attacks. Similarly, a study of 38 bus stops located within a high crime area of Los Angeles, California showed that 20 percent of the stops suffered about half the crime at all these bus stops.11
- Shops: a national survey undertaken in 2000 found that 1 percent of 4315 small businesses in Australia experienced 66 percent of all crimes reported in the survey. 12 Similarly, a study of shoplifting in 78 stores in Danvers, Massachusetts found that 20.3 percent of the stores experienced 84.9 percent of the shoplifting incidents (see Table 2). 13
Although the studies in this list are just a few of those that have produced evidence of risky facilities, such results make it clear that this form of crime concentration is quite widespread.
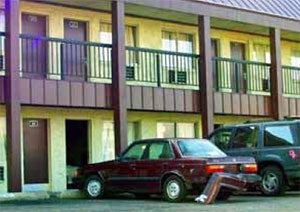
Low Cost Motel: The risk of crime varies a great deal among facilities of the same type. Photo Credit: John Eck
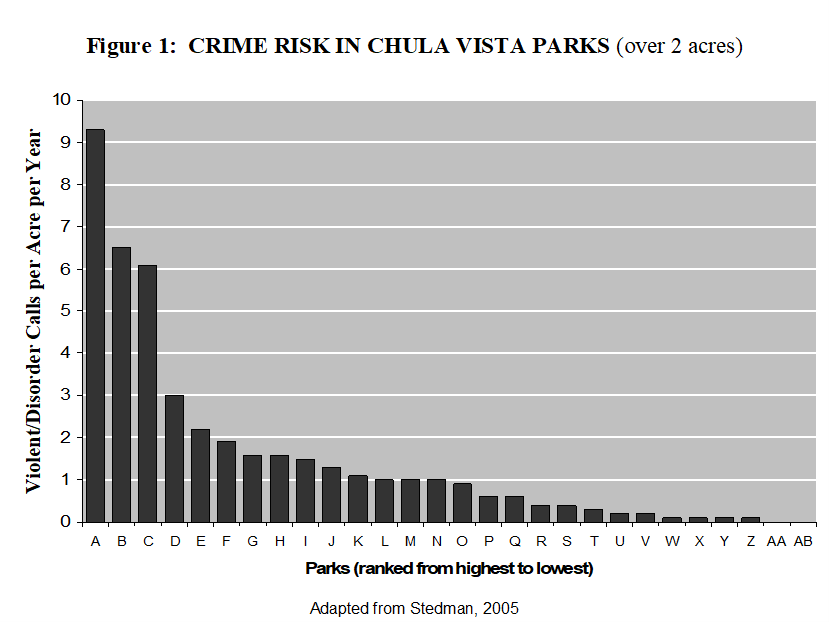
When analysts plot the number of crimes at each facility under investigation, they almost always create a graph with a reclining-J shape. This can be seen in the example in Figure 1, based on the work of crime analysts in Chula Vista, California. In that study, all parks over two acres in Chula Vista were ranked from the most crime (on left) to the least. The heights of the bars show the number of crimes in each park. As can be seen, three parks had far more crime than any of the rest and most parks had very little crime.
![]()
![]()
Free Bound Copies of the Tool Guides
You may order free bound copies in any of three ways:
Online: Department of Justice COPS Response Center
Email: askCopsRC@usdoj.gov
Phone: 800-421-6770 or 202-307-1480
Allow several days for delivery.
Email sent. Thank you.
Understanding Risky Facilities
Send an e-mail with a link to this guide.
* required
Error sending email. Please review your enteries below.
- To *
Separate multiple addresses with commas (,)
- Your Name *
- Your E-mail *
Copy me
- Note: (200 character limit; no HTML)
Please limit your note to 200 characters.