
Why Do Facilities Vary in Risk?
Because there is no single reason why facilities vary in risk, it is important to determine which reasons are in operation in each particular case. The most important sources of variation in risk follow.
- Variations in Size. Facilities of the same general type can vary quite markedly in size; other things being equal, one would expect larger facilities to report more problematic incidents than smaller ones. Of course, examining variations in the number of incidents without controlling for size can sometimes be important. For example, if you were to discover at the scanning stage that the great majority of incidents occurred in just a few facilities, irrespective of size, you would know where to concentrate your efforts in order to bring about the maximum reduction in the overall problem. For some analyses, however, it can be important to control for size. There are various ways to estimate size. For example, acreage might be appropriate for parks, number of spaces for parking lots, shelf footage for self-service stores, number of students for schools, number of rooms and occupancy rates for hotels and motels, and so forth. One example of such an analysis comes from a study of shoplifting in Danvers, Massachusetts. The store with the most shoplifting incidents in Danvers was one of the largest in the city. But this was not the whole story, however, because when size was taken into account by calculating the number of shoplifting incidents per 1000 square feet (see the final column of Table 2), the riskiest store turned out to be the one that had been ranked 15th on the list before the outcome was corrected for size.
Table 2: Reported Shopliftings by Store, Danvers, Mass. October 2003 to September 2004
| Store | Shopliftings | Percent of Shopliftings | Cumulative % of Shopliftings | Cumulative % of Stores | Shopliftings per 1000 Sq.Ft. |
|---|---|---|---|---|---|
| 1 | 78 | 26.2 | 26.2 | 1.3 | 1.54 |
| 2 | 42 | 14.1 | 40.3 | 2.6 | 0.70 |
| 3 | 28 | 9.4 | 49.7 | 3.8 | 0.22 |
| 4 | 16 | 5.4 | 55.0 | 5.1 | 0.24 |
| 5 | 15 | 5.0 | 60.1 | 6.4 | 0.28 |
| 6 | 12 | 4.0 | 64.1 | 7.7 | 0.31 |
| 7 | 11 | 3.7 | 67.8 | 9.0 | 0.09 |
| 8 | 11 | 3.7 | 71.5 | 10.3 | 0.16 |
| 9 | 9 | 3.0 | 74.5 | 11.5 | 0.28 |
| 10 | 7 | 2.3 | 76.8 | 12.8 | 2.82 |
| 11 | 5 | 1.7 | 78.5 | 14.1 | 0.16 |
| 12 | 5 | 1.7 | 80.2 | 15.4 | 0.10 |
| 13 | 4 | 1.3 | 81.5 | 16.7 | 0.35 |
| 14 | 4 | 1.3 | 82.9 | 17.9 | 0.12 |
| 15 | 3 | 1.0 | 83.9 | 19.2 | 3.32 |
| 16 | 3 | 1.0 | 84.9 | 20.5 | 0.90 |
| 17 | 3 | 1.0 | 85.9 | 21.8 | 0.02 |
| 7 stores with 2 incidents | 14 | 4.7 | 90.6 | 30.8 | 0.08 |
| 28 stores with 1 incident | 28 | 9.4 | 100.0 | 66.7 | 0.06 |
| 26 stores with 0 incidents | 0 | 0.0 | 100.0 | 100.0 | 0.00 |
| Total stores = 78 | 298 | 100.0 | 100.0 | 100.0 | 0.15 |
Unfortunately, it is not always easy to obtain the data needed to correct for the size of the facilities under study. For example, a study of downtown parking lot thefts in Charlotte, North Carolina was impeded when the city was unable to provide data about the number of spaces in each lot.16 As a result, police officers had to visit each lot and count the spaces by hand.
2. Hot products. A risky facility that does not have a large number of targets might have targets that are particularly desirable. For example, Store 15 in Table 2, which had the highest rate of shoplifting in the city per 1000 square feet, specialized in selling small, high value electronic items that meet the CRAVED criteria, i.e. they are Concealable, Removable,Available, Valuable, Enjoyable and Disposable.§
§ See Clarke, Ronald (1999). Hot Products. Police Research Series. Paper 112. London: Home Office. See also Problem-Solving Tool Guide No. 12, Understanding Theft of 'Hot Products'.
3. Location. It only makes sense that facilities that are located in high crime areas are likely to be at a greater risk for crime. However, why this is so is the subject of much debate. One theory holds that habitual offenders tend to live in high crime areas and that such offenders prefer not to travel too far to commit crime. One way of testing this theory is to study facilities that are located in close proximity to each other. If all nearby similar facilities have similar levels of crime, but the crime levels in these nearby facilities are different from similar facilities located in other neighborhoods, then proximity to offenders might be the explanation. However, if crime levels at similar facilities vary within the neighborhood itself, or if crime levels are similar across neighborhoods, then you might do well to look for a different cause. Another way of testing this theory would be to examine the addresses of the offenders who commit crimes in these facilities: if those who offend in high risk facilities live near such facilities, then location might explain the heightened risk of victimization; and conversely, one would expect those who offend in low risk facilities to have traveled a greater distance to do so. On the other hand, if offenders travel about the same distances to both types of facilities, or if no clear pattern emerges, then it may be that the proximity of offender populations to potential targets is a less than useful explanation. For example, when the Chula Vista Police Department looked at the locations of motels they found that all of them—high and low crime—were located in high crime areas.17
4. Repeat victimization. Because some places attract people who are particularly vulnerable to crime, it can sometimes be useful to compare the individuals who have been victimized in risky and non-risky facilities. If re-victimization rates are different, then repeat victimization may be the cause of the elevated risk. On the other hand, facilities that cater to different populations that have different vulnerabilities may themselves vary in risk. For example, an apartment building with a large number of domestic violence calls might have many repeat domestic violence households, whereas a building with few calls might have no repeat domestic violence incidents.
5. Crime attractors. Facilities that draw in large numbers of offenders are crime attractors. Crime attractors have high numbers of offenders and high offense rates. For example, some bars have a reputation for attracting unruly crowds; some even include this ability to attract a rough crowd in their advertising. Such facilities are likely to experience a high rate of victimization. For example, an investigation of corner drug markets in Cincinnati, Ohio suggested that some corner grocery stores catered to the drug trade in a number of ways, thus attracting offenders.18 Diagnostic checks can involve analyzing arrest records and other information containing offender names.
6. Poor design and layout. For any group of facilities, there are importantdesign features that can improve security. For example, users of ATMs are less likely to be robbed if the machine is located in an enclosed vestibule that requires a cash card for entry, if the vestibule has windows, if surveillance cameras are installed, and so forth.§ Similarly, there are a number of design standards that can reduce shoplifting, including reducing the number of store exits, eliminating blind corners and recesses, creating clear sight lines in aisles, reducing the height of displays, placing goods away from exits, and carefully deploying mirrors and lighting.§§ When design guidelines are not followed, the risk of crime increases.
§ See Mike Scott, Robbery at Automated Teller Machines, Problem Specific Guide No. 8 (Washington, D.C.: Office of Community Oriented Policing Services, U.S. Department of Justice, 2001).
§§ See Ronald Clarke, Shoplifting, Problem Specific Guide No. 11 (Washington, D.C.: Office of Community Oriented Policing Services, U.S. Department of Justice, 2002).
7. Poor management. When management does not exercise proper control over its establishment, a risky facility can develop. If high crime facilities have few rules, lax enforcement, poor security, or other features or omissions that help offenders detect targets, commit crimes, and get away, then poor management may be an important factor in the rate of victimization. Similarly, if high crime facilities have many targets or more highly desirable targets (either hot products or repeat victims), but managers fail to enhance target protection, management must bear some responsibility for the crime problem. The important role of management is illustrated in Box 3, which shows how crime greatly increased in certain low rent apartment buildings after they were acquired by a notorious slumlord.
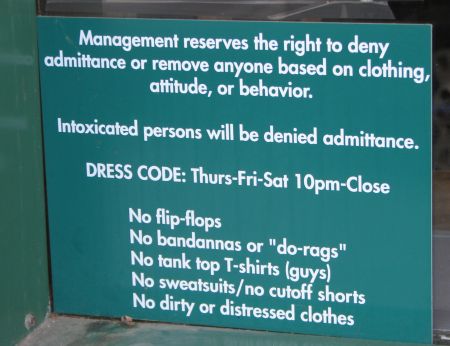
A sign outside a bar: How managers regulate patron conduct can have a big influence on crime risk. Credit: John Eck
Box 3: Slumlords, Crime in Low Rent Apartments and Neighborhood Blight
In every large city, a few low-cost rental apartment buildings make extraordinary demands on police time. These "risky facilities" are often owned by slumlords—unscrupulous landlords who purchase properties in poor neighborhoods and who make a minimum investment in management and maintenance. Building services deteriorate, respectable tenants move out, and their place is taken by less respectable ones—drug dealers, pimps, and prostitutes who can afford to pay the rent but who cannot pass the background checks made by more responsible managements. In the course of a problem-oriented policing project in Santa Barbara, California, Officers Kim Frylsie and Mike Apsland analyzed arrests made at 14 rental apartment buildings owned by a slumlord, before and after he had purchased them. The table clearly shows a large increase in the number of people arrested at the properties in the years after he acquired them. There was also some evidence that the increased crime and disorder in these properties spilled over to infect other nearby apartment buildings—a finding that supports the widespread belief that slumlords contribute to neighborhood blight.
| Property | Year Aquired | No. of Units | Average Pre-Owning | Yearly Arrests Post-Owning |
|---|---|---|---|---|
| 1 | 1977 | 4 | 0 | 1.6 |
| 2 | 1982 | 15 | 0 | 16.9 |
| 3 | 1983 | 8 | 0 | 2.3 |
| 4 | 1985 | 8 | 0 | 4.5 |
| 5 | 1985 | 10 | 0.1 | 6 |
| 6 | 1986 | 16 | 0.2 | 27.9 |
| 7 | 1986 | 6/8 | 0 | 3.4 |
| 8 | 1987 | 5 | 0 | 8.3 |
| 9 | 1987 | 12 | 0 | 11.3 |
| 10 | 1988 | 6 | 0.4 | 8.1 |
| 11 | 1991 | 10 | 0.2 | 9.3 |
| 12 | 1991 | 10+ | 2.3 | 21.8 |
| 13 | 1992 | 4+ | 1.1 | 0.7 |
| 14 | 1992 | 4 | 0.2 | 10.7 |
Source: Clarke, Ronald and Gisela Bichler-Robertson (1998). "Place Managers, Slumlords and Crime in Low Rent Apartment Buildings." Security Journal, 11: 11-19.
Table 3: Responses to Risky Facilities
| Cause | Description | Responses |
|---|---|---|
| Size | Facility is large and attracts many users, some of whom become victims. | If the number of crimes per user is very small compared to most other facilities, then one option is to do nothing. Alternatively, identify those most likely to become victims and the circumstances associated with their victimization, then focus on these individuals and circumstances. |
| Hot Products | Facility contains a large number of things that are particularly vulnerable to theft or vandalism. | Remove hot products. Provide additional protection to hot products. |
| Location | Facility may be located in close proximity to offenders. | Hire additional security. Tailor management practices to the peculiarities of the area. |
| Repeat Victims | Facility contains a few victims who are involved in a large proportion of crimes. | Provide victims with the information or inducements they need to make behavioral changes that will reduce their likelihood of victimization. Provide information or protection to victims so that they are not victimized again. |
| Crime Attractor | Facility attracts many offenders or a few high rate offenders. | Remove offenders through enforcement and incapacitation or rehabilitation. Deny access to repeat offenders. |
| Poor Design | Physical layout makes offending easy, rewarding or inducing risk. | Change the physical layout in conformity with principles of Crime Preventionthrough Environmental Design (CPTED).§ |
| Poor Management | Management practices or processes enable or encourage offending. | Change management procedures, paying particular attention to practices that influence repeat victimization. |
§ For additional information on CPTED principles see Using Crime Prevention Through Environmental Design in Problem Solving, Response Guide #6.
![]()
![]()
Free Bound Copies of the Tool Guides
You may order free bound copies in any of three ways:
Online: Department of Justice COPS Response Center
Email: askCopsRC@usdoj.gov
Phone: 800-421-6770 or 202-307-1480
Allow several days for delivery.
Email sent. Thank you.
Understanding Risky Facilities
Send an e-mail with a link to this guide.
* required
Error sending email. Please review your enteries below.
- To *
Separate multiple addresses with commas (,)
- Your Name *
- Your E-mail *
Copy me
- Note: (200 character limit; no HTML)
Please limit your note to 200 characters.